
By Willona Sloan
Infographics provide an excellent way to highlight data and capture readers’ attention while adding artistry to technical information. They work well across different platforms from social media to websites to print publications because they can be used to convey complex information in a digestible format. Building an infographic requires some real work. Here are tips for creating a visually appealing and info-rich infographic.
Pick Your Points
First, determine what data you will use to create a narrative. The beauty of this type of graphic is that you can highlight multiple data points. You will want to have a cohesive theme that draws the points together so they are not an unconnected random slate of icons.
Make sure that your infographic tells a story. What’s new or interesting about this data? What do you want the reader to understand or do with this information?
Think in Pictures
Think about the kind of data you have traditionally put into a pie chart or a line graph. Can these figures be represented in a more interesting visual way? This infographic provides some good examples of how to depict data points in dynamic ways:
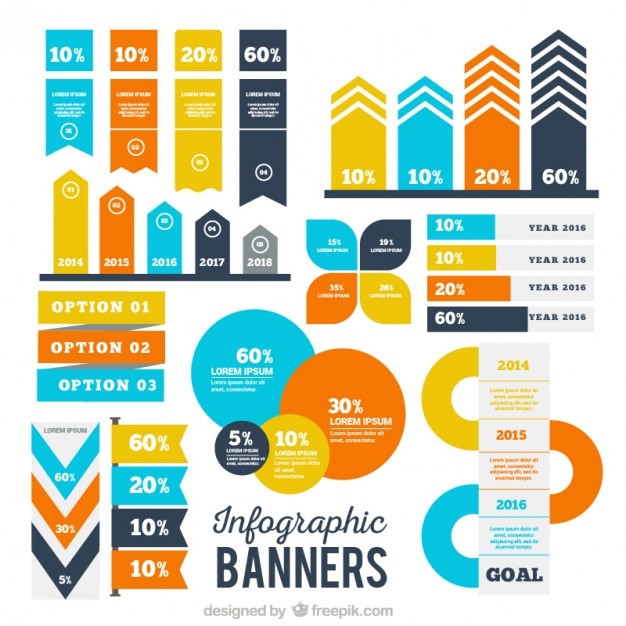
What about data based on gender type? Those numbers lend themselves to visualization very easily. Color-coded maps also provide an easy tool for data visualization. Use icons to draw the eye to the data point. If you’re talking about an increase in coffee consumption, use coffee visuals. A drop in TV viewership requires TV-related imagery. Using icons can take the place of text when done with easily recognizable images.
Tie it Together with Text
Readers should be able to look at the infographic and take away concrete information. Use headlines, headers, captions and brief amounts of text to tie the visuals together and explain your point. Be clear, be accurate and cite your sources.
Take the time to plan your infographic and look at examples for inspiration.
Infographics can go wrong with too much random data and a lack of coherent design. Or, they can be both attractive and informative like this example here. The difference is in the planning.
For the best results, you should employ a graphic designer; however, there’s plenty of infographic builders out there that will help you create a professional looking product. Check out the 10 infographic builders listed in this blog post.
Infographics provide an opportunity for whimsy and experimentation. Be bold! Try something new.
